Asaan aur Effective Trading Strategy ! Jaanein Proven Strategy jo day trading aur swing trading mein aapke munafe ko badhane mein madad karegi
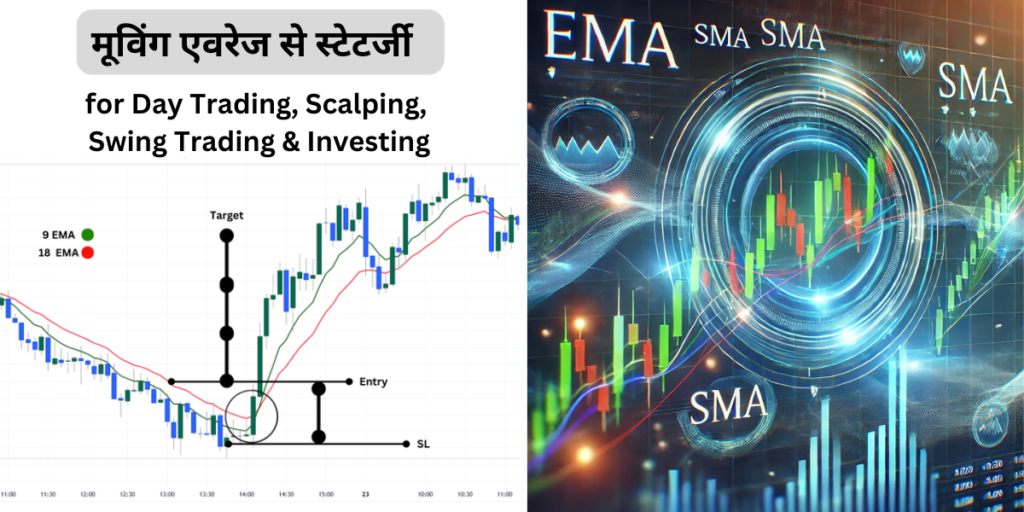
EMA और SMA का उपयोग करके सफल ट्रेडिंग करें
Dual Moving Average Crossover strategy
9 EMA & 18 EMA Crossover
– Buy Signal: 9 EMA crosses above 18 EMA (bullish momentum).
– Sell Signal : 9 EMA crosses below 18 EMA (bearish reversal).
– Best For : 5-minute or 15-minute charts on indices like Nifty50 , BankNifty , Sensex


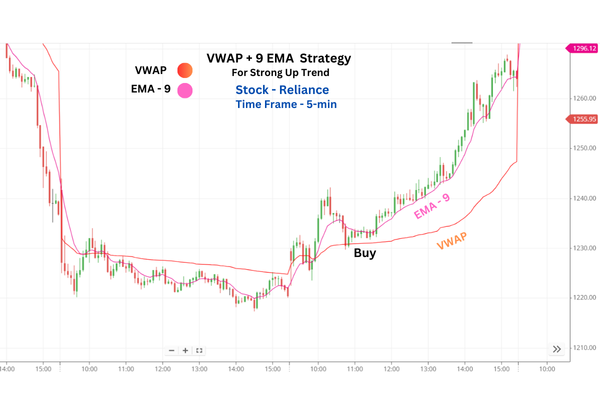
VWAP + 9 EMA Day Trading Strategy – For Strong Up Trend only
- Enter long if price holds above VWAP and 9 EMA acts as support.
- Enter short if price stays below VWAP and 9 EMA acts as resistance.
- Best For : 5-minute or 15-minute charts on Stock only and for Strong up trend only
- Not Applicable on any Index
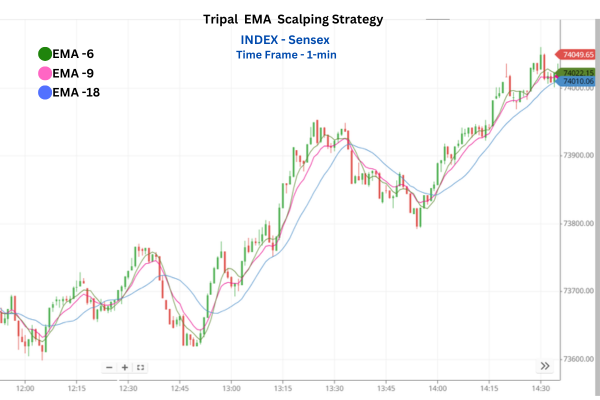
Triple EMA Scalping Strategy – 6 EMA,9 EMA,18 EMA
- Best For : 1-minute Scalping or 3 -minute Scalping charts on indices like BankNifty , Sensex
- Scalping ek High-Frequency Trading strategy hai, carefully trade Kare
Entry Rules (Buying):
- Jab 6 EMA aur 9 EMA, 18 EMA ke upar ho, tabhi entry consider karein.
- Pullback par entry lein jab price 9 EMA ya 18 EMA ke paas aaye.
- Confirmation ke liye 6 EMA aur 9 EMA ko kam se kam 5 minute (5 candles of 1 min) tak 18 EMA ke upar sustain karne dein.
- Trade ka holding time sirf 1 min se max 5 min tak rahega.
- Stoploss – Agar 18 EMA ke niche koi bhi Candle Close Hoti hai to Trade se nikal jaye . Ya fir Aap Position Sizing aur risk managment se aap ka SL fix rakh sakte hai .
- Exit: Secure 0.5%-1% gains (Option Trading )
Entry Rules (Selling):
- Jab 6 EMA aur 9 EMA, 18 EMA ke neeche ho, tabhi short-selling entry karein.
- Pullback par entry lein jab price 9 EMA ya 18 EMA ke paas aaye.
- Confirmation ke liye 6 EMA aur 9 EMA ko kam se kam 5 minute (5 candles of 1 min) tak 18 EMA ke neeche sustain karne dein.
- Trade ka holding time sirf 1 min se max 5 min tak rahega.
- Stoploss – Agar 18 EMA ke Upar koi bhi Candle Close Hoti hai to Trade se nikal jaye . Ya fir Aap Position Sizing aur risk managment se aap ka SL fix rakh sakte hai .
Best for Intraday Scalping | Fast Trade Execution | Trend Confirmation
Swing Trading Strategies with Moving Averages
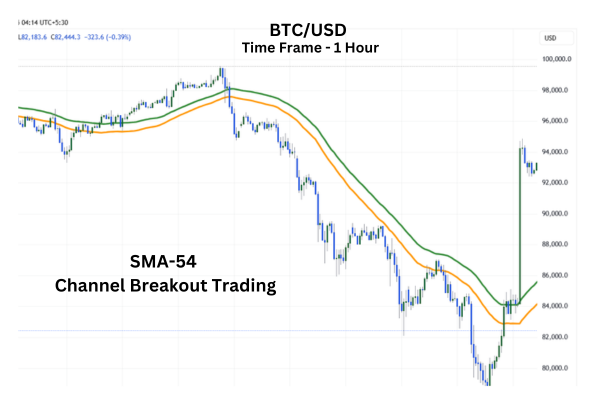
SMA 54 Channel Breakout Strategy
Asaan aur Effective Trading Strategy
SMA 54 Channel Breakout Strategy ek trend-following technique hai jo SMA 54 High aur SMA 54 Low ka use karke buy aur sell signals detect karti hai. Yeh strategy stocks aur indices (NIFTY, Bank NIFTY, Reliance, TCS, etc.) ke liye perfect hai. Iska biggest advantage hai – No Noise, Only Clear Signals!
Timeframe (Best Timeframe Kya Hai?)
15-minute ya 30-minute chart pe best work karti hai.
Swing trading ke liye higher timeframe pe bhi use ho sakti hai.
Indicators Used (Kaunse Indicators Lagane Hai?)
🔴 SMA 54 – High (Red Line) – Resistance zone dikhata hai.
🟢 SMA 54 – Low (Green Line) – Support zone dikhata hai.
Yeh dono lines ek dynamic channel banati hain jo breakout aur trend reversal pakadne me madad karti hain.
Trading Rules (Entry-Exit Kaise Kare?)
Short Entry (Sell Trade):
Jab price SMA 54 – Low ke neeche close kare, bearish trend confirm hota hai.
Agle candle pe short trade enter karein.
Stop-Loss: SMA 54 – High ke upar rakhein.
Target: Risk ka 1.5x ya 2x profit le sakte hain ya moving average ke sath trail karein.
Long Entry (Buy Trade):
Jab price SMA 54 – High ke upar close kare, bullish trend confirm hota hai.
Agle candle pe long position enter karein.
Stop-Loss: SMA 54 – Low ke neeche rakhein.
Target: Risk ka 1.5x ya 2x profit ya trailing stop-loss use karein.
SMA 54 Strategy Ke Fayde (Kyun Use Karein?)
Simple aur Asaan – Bas SMA Channel follow karein, no complex indicators!
Har Market Ke Liye Useful – Stocks, Indices, NIFTY, Bank NIFTY sabke liye kaam karega.
No Noise, Sirf Clean Signals – Market ke unnecessary fluctuations avoid karta hai.
Trend Confirmation – Sirf strong breakouts pe trade karne ka confidence deta hai.
Yeh strategy specially intraday traders ke liye bani hai jo consistent aur profitable trading karna chahte hain.
Long-Term Investing Strategies with Moving Averages
Moving Averages Short term & Long-Term Investment Ke Liye Ek Powerful Tool ,Yeh market trends ko samajhne aur sahi investment decisions lene me help karta hai.
Stock Trend Identification (Stock ke Trend ko Samajhna)
Stock Trend Identification – 200-day SMA se market ka primary trend identify kiya ja sakta hai.
Agar price SMA ke upar hai, to bullish trend hota hai.
Agar price SMA ke neeche hai, to bearish sentiment dikhata hai.
Agar price lambe samay tak SMA 200-day ke upar consistently move karta hai, to bull market ka signal milta hai. Agar neeche hai, to bear market ka indication hota hai.
Crossovers for Entry/Exit (Entry-Exit Ke Liye Signals)
Golden Cross – Jab 50-day MA, 200-day MA ko upar cross karta hai, to bullish momentum dikhata hai. Yeh investors ko stocks me investment badhane ka signal deta hai.
Death Cross – Jab 50-day MA, 200-day MA ko neeche cross karta hai, to bearish sentiment ka indication hota hai. Is situation me risk kam karne ke liye equity exposure ghata sakte hain.
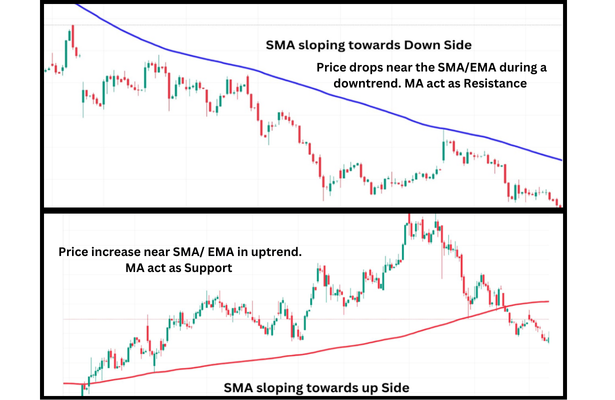
Moving Average Support & Resistance Ka bhi kam Karte Hai
Bullish market me, agar price SMA se support lekar wapas aaye, yani bounce back karti hai to buying opportunity ho sakti hai.
Bearish market me, SMA ek strong resistance level ka kaam karta hai.price SMA se takrakar vapas niche aati hai yaha par aap short selling kar sakte hai .

200 SMA se Portfolio Management
Tactical Adjustments – Jab price 200-day SMA ke upar ho, to stocks me invest karein. Agar neeche ho, to bonds/cash me shift karke downside risk kam kar sakte hain.
Rebalancing Triggers – Jab price kisi SMA ke upar ya neeche break karta hai, to portfolio rebalancing ka signal milta hai.
Moving Averages ek systematic framework dete hain jo investors ko trend ke sath invest karne, risk manage karne aur emotional decisions avoid karne me help karta hai.
Moving Average Trading Strategy IMP rules.
- Simple to implement; effective in trending markets.
- Versatile across assets (forex, stocks, futures).
- Avoide Sideways market as its lagging Indicator.
- Always Take confirmation (e.g., volume, Support & Resistance ) to reduce false signals.
- Risk Management: Never risk more than 1-2% per trade; trail stops using MAs
- Timeframes: Use shorter MAs (6-9 periods) for scalping; longer (50-100) for swing setups
- Market Hours: Focus on volatility periods (e.g., stock market open) for clearer trends.
Comparison of Moving Averages and Trading Types
Trading Type | Best Moving Averages |
Day Trading | 6 EMA, 9 EMA, 18 EMA |
Scalping | 3 EMA, 6 EMA, 9 EMA, 18 EMA |
Swing Trading | 18 EMA, 50 EMA, 100 EMA |
Investing | 50 SMA, 100 SMA, 200 SMA |
Options Trading | 9 EMA, 21 EMA |
Futures Trading | 18 EMA, 50 EMA, 100 EMA |
FAQs: Moving Average Trading Strategies
Q: What’s the best EMA for day trading?
A: The 6 EMA and 18 EMA crossover on 5-minute charts is highly effective.
Q: How do I use the 200 SMA for investing?
A: Hold stocks above 200 SMA; avoid or short those below it.
Q: Which EMA works for scalping?
A: The 3 EMA system (6, 9, 18 EMA) on 1-minute charts suits scalpers.
READ MORE
Stock market investment opportunities in logistics and warehousing sector in India