
Natural Gas (NG) Chart Analysis – Key Support and Resistance Levels Explained (MCX Futures)
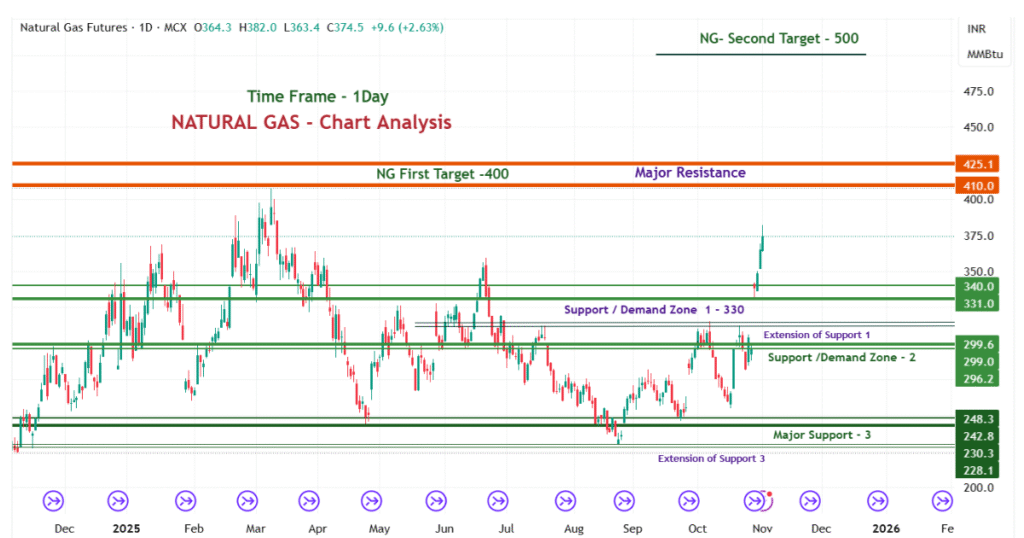
Natural Gas (MCX Futures) After sitting in a tight range for weeks, prices broke out sharply and reached around ₹378.6 that’s roughly a +3.75% jump in just one session.
Natural Gas has been acting pretty strong. This is signals that buyers are finally stepping back in and pushing the trend toward the next resistance area.
So, in this Natural Gas chart analysis, we’ll stick to the support and resistance zones , since these tend to be the most dependable parts of price action trading.
Current Natural Gas Price Overview
(MCX – 1D Chart)
- Right now, NG Futures trade close to ₹378, showing solid up trend. The breakout from that ₹330–₹340 patch pretty much shifted the whole tone from sideways to bullish again.
- If this push keeps going, the next stop for buyers might be near ₹400 a round number that often acts like a wall in traders’ minds.
- Should prices stay firm above ₹400, the next stretch could be toward ₹425–₹500, which looks like the upper resistance band.
- If things cool off, though, ₹330 still works as the first support area. Below that, ₹299 and ₹242 remain crucial points for anyone holding medium-term positions.
Key Natural Gas Support and Resistance Levels (MCX Futures)
Based on 1D timeframe analysis
Support / Resistance | Price Zone (₹) | Remarks |
Support 1 | 330–340 | Short-term demand pocket |
Support 2 | 296–299 | Strong positional base |
Support 3 | 230–248 | Long-term cushion zone |
Resistance 1 | 400–410 | First Possible Target |
Resistance 2 | 425–430 | Possible profit-taking area |
Resistance 3 | 500 | Long-term extension if breakout stays strong |

What to Watch Right Now in NG Price Action
- If NG manages to hold above ₹340, there’s a good chance the price drifts up toward ₹400–₹410 pretty soon.
- A daily close past ₹410 can, in a way, confirm that the next wave might push toward ₹425–₹500.
- If the market slips below ₹330, though, it might retest ₹299.
₹248–₹242 region is the big support area where buyers usually active again.
Chart Pattern Outlook – Technical View
At this stage, NG trades in what looks like a fresh bullish breakout. The earlier resistance near ₹330 is now acting as a sturdy support line. That switch from resistance to support .
So traders might want to watch the ₹400–₹410 level carefully. That’s where the next major reaction is likely to happen.
Bullish Breakout Scenario
If the price stays above ₹400, a move toward ₹425–₹500 becomes quite possible. A strong candle with volume above ₹410 would confirm that momentum, inviting more buyers into the trend.
Bearish Pullback Scenario
If the market fails to stay above ₹340, then a pullback toward ₹299–₹296 could happen. That wouldn’t be a total reversal — more like a healthy breather as long as the price holds above ₹242–₹248.
This structure-based reading helps traders plan entries and exits without using a bunch of indicators — just clean price action, pure and simple.
Expert Take – Connection with Global Commodities
- Natural Gas prices tend to move with global energy trends, seasonal demand shifts, and crude oil patterns. Recently, weather forecasts turned colder for the eastern U.S. for November that news, helped to lift Natural Gas prices in the week.
- As winter approaches, this kind of weather-driven demand could keep NG prices fairly supported for a while.
- Still, if crude oil or broader energy markets slide sharply, NG might face short-lived pullbacks.
- From a technical view, though, buyers still seem in charge as long as prices hold above ₹330. That ₹400 level remains the key pivot — deciding whether we get another push toward ₹500 or a retest back near ₹300.
🧩 Summary Outlook
- Natural Gas is comfortably holding above its breakout zone at ₹330, keeping the overall setup bullish. The tug-of-war between ₹330–₹340 support and ₹400–₹410 resistance will decide what happens next.
- For short-term traders, it’s a good idea to watch how the price behaves near ₹400. Maybe take partial profits there and trail the stop-loss near ₹340.
- For positional players, staying above ₹330 could still give room for a move up to ₹425–₹500 in the coming weeks.
Always keep stop-losses tight to manage risk properly.
👉 Follow TradingDemand for more daily Natural Gas updates, chart views, and support-resistance setups.
❓FAQ
Q1: What’s the current trend in Natural Gas (MCX)?
Natural Gas is in a bullish breakout phase, trading comfortably above ₹330–₹340.
Q2: Which resistance levels are key for 2025?
₹400–₹410, ₹425, and ₹500 remain the main zones to watch for potential profit booking.
Q3: What are the best support levels for swing entries?
₹330, ₹299, and ₹242 — all strong areas where traders may look to re-enter during pullbacks.