
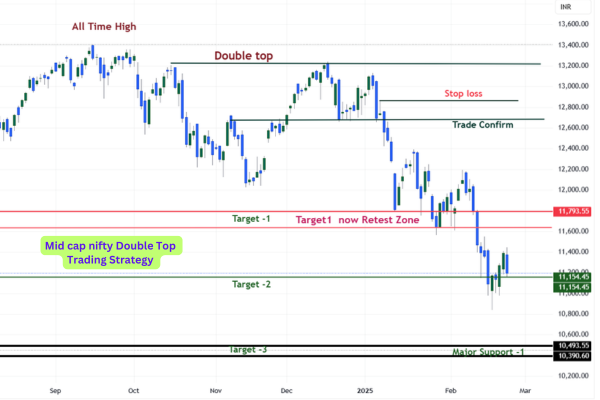
The Nifty MidCap Select Index is currently trading at 11,198.90, down 1.69% for the session ,despite the short-term downtrend, the index recently rebounded from a key support zone (10490 – 10390) if this level holds next week then their is chances of up side .
निफ्टी मिडकैप सेलेक्ट इंडेक्स आज 11,198 के स्तर पर ट्रेड कर रहा है, जो सत्र में 1.69% की गिरावट दिखा रहा है। हालांकि, इंडेक्स ने की सपोर्ट ज़ोन (10490 – 10390 ) से रिबाउंड किया है। अगर यह सपोर्ट अगले हफ्ते भी टिका रहता है, तो अपसाइड (ऊपर की ओर मूवमेंट) की संभावना बन सकती है।
This article outlines a detailed trading plan for the Nifty MidCap Select Index, covering key support and resistance levels, breakout points, and the best entry and stop-loss strategies for traders.
Nifty MidCap Select Index:Breakout levels Trading Strategy
Current Market Status
- The index is trading at 11,198, indicating a Strong Down Trend for the session.
- A bounce from Support -1 (11,068 – 11,015) but Major Support is 10490 – 10390 suggests bullish potential if sustained.
- Price action near these levels will determine the next directional move.

Nifty MidCap Select Index: Support and Resistance Levels
Important Resistance Levels
- Immediate Resistance1 : 11,600 – A breakout above this level may indicate further bullish momentum towards 11,800 – 11,830.
- Resistance2 : 11,800 – 11,830 – A significant supply zone where sellers may step in.
- Major Resistance1: 12,100 – 12,170
Important Support Levels
- Support1 : 11,068.60 – 11,015.55 – The key support zone holding the index.
- Major Support1: 10,390 – 10,493.55 – A strong demand zone where buyers may re-enter.
- Extended Support: 10,060.20 – 9,995.05 – A strong demand zone Extension where buyers may re-enter.
Nifty MidCap Index Best entry points for Trading
Bullish Scenario (Long Trades)
- Entry: Buy if the index sustains above 11,600 or near 11,068 – 11,015.
- Targets:
- 11,800 – 11,830 (Immediate resistance)
- 12,100 – 12,170 (Major resistance 1)
- Stop Loss: Below 10,990 for trades near the support zone.
Bearish Scenario (Short Trades)
- Entry: Sell if the index retests 11,600 or breaks below 11,015.
- Targets:
- 10,490 – 10,390 (Major support 1)
- 10,060 – 9,995 (Extended support zone)
- Stop Loss: Above 11,700 / 11090 for trades near resistance.
Best Entry Points for Nifty MidCap Index
- Buy Zone1 : Above 11,060, with a stop loss below 10,990.
- Buy Zone2 : Above 10400 – with a stop loss below 10330
- Sell Zone1 : below 11000 , with a stop loss above 11100
- Sell Zone2 : Near 11,600 – 11,630, stop loss above 11,650
- Sell Zone3 : Near 11,800 – 11,830, stop loss above 11,890.
Key Technical Patterns & Trading Signals
- Downtrend Resistance: Lower highs indicate active sellers. If price rallies but fails to break the previous high, the downtrend may persist.
- Volume Confirmation: Rising volume near support/resistance validates the strength of the trend.
- Breakout Confirmation: A move above 11,650 could trigger upside momentum, while a break below 11,000 may signal further downside.
Market Outlook & Future Prospects
Short-Term Volatility
- Mid-cap stocks often experience sharper market corrections than large caps.
- Traders should monitor global market trends and broader Nifty index movements for confirmation.
- Election Result Day Low is a crucial level to watch as FII and DII buying trends may provide insights into market direction.
Long-Term Growth & Sector Rotations
- Historically, mid-cap stocks have outperformed over extended periods, offering higher returns for moderate-risk investors.
- Sector rotations favor mid-cap segments with strong growth potential, such as renewable energy and consumer goods.
Conclusion
The Nifty MidCap Select Index is at a critical juncture. The 11,068 – 11,015 support zone is holding firm, while 11,650 is a key level to watch for a trend reversal. Traders should use this trading plan, support & resistance levels, and entry strategies to navigate the market effectively. Staying updated with global market cues and sector trends can enhance decision-making and improve trade success rates.
This analysis provides a comprehensive trading plan for both bullish and bearish traders. Using these technical levels, swing trading strategies, and breakout targets, traders can develop well-informed market positions. Keep a close eye on key support and resistance zones, and adjust strategies accordingly! Best of Luck .
Nifty MidCap Select Index trading plan in hindi
ट्रेडिंग रणनीति
बुलिश ट्रेड:
- एंट्री: 11,600 से ऊपर खरीदें या 11,068 – 11,015 पर खरीदें।
- टार्गेट: 11,800 – 11,830, 12,100 – 12,382.90,
- स्टॉप लॉस: 10,990 के नीचे।
बेयरिश ट्रेड:
- एंट्री: 11,600 पर रीटेस्ट या 11,015 के नीचे ब्रेक।
- टार्गेट: 10,490 – 10,390, 10,060 – 9,995।
- स्टॉप लॉस: 11,700 / 11100 के ऊपर।
निष्कर्ष
- 10,490 – 10,390 सपोर्ट मजबूत।
- 11,650 से ऊपर बुलिश, 11,015 से नीचे बेयरिश।
- ग्लोबल ट्रेंड्स और Nifty मूवमेंट पर नज़र रखें।
Nifty Confirm Targets for Intraday Option Trading 2025
What are Indias top 9 sectors for next 3 years?
Share market ke andar ki baat | शेयर मार्केट की अंदर की बात जनहित में जारी