चार्ट पैटर्न्स, जिन्हें “प्राइस पैटर्न” ( Price Pattern) भी कहा जाता है, ट्रेडर्स को मार्केट रिवर्सल या ट्रेंड कंटिन्यूएशन के संकेत देते हैं। ये पैटर्न चार्ट पर स्पष्ट दिखाई देते हैं और अच्छे रिस्क-टू-रिवॉर्ड रेश्यो के साथ ट्रेडिंग अवसर प्रदान करते हैं। सफलता के लिए ब्रेकआउट कन्फर्मेशन और सही स्टॉप-लॉस प्लेसमेंट महत्वपूर्ण हैं।
Candlestick chart Patterns Swing Trading Strategy
- Chart Patterns are used as either reversal or continuation signals. -चार्ट पैटर्न को रिवर्सल या कंटिन्यूएशन संकेतों के रूप में उपयोग किया जाता है।
- A chart pattern is also called a price pattern- चार्ट पैटर्न को प्राइस पैटर्न भी कहा जाता है।
- Chart patterns do not provide directional clues; you need to look for breakouts – चार्ट पैटर्न दिशात्मक संकेत नहीं देते; ब्रेकआउट देखने की आवश्यकता होती है।
- These patterns are easily visible on charts and offer a good risk-to-reward ratio when formed – ये पैटर्न चार्ट पर आसानी से दिखाई देते हैं और अच्छे रिस्क-टू-रिवॉर्ड मिलने की संभावना होती है ।
Main Types of Candlestick Chart Patterns technical analysis
- Reversal Chart Patterns – रिवर्सल चार्ट पैटर्न
- Continuation Chart Patterns – कंटिन्यूएशन चार्ट पैटर्न
- Bilateral Chart Patterns – बाइलेटरल चार्ट पैटर्न
Triangle Candlestick Chart Patterns – ट्रायंगल चार्ट पैटर्न
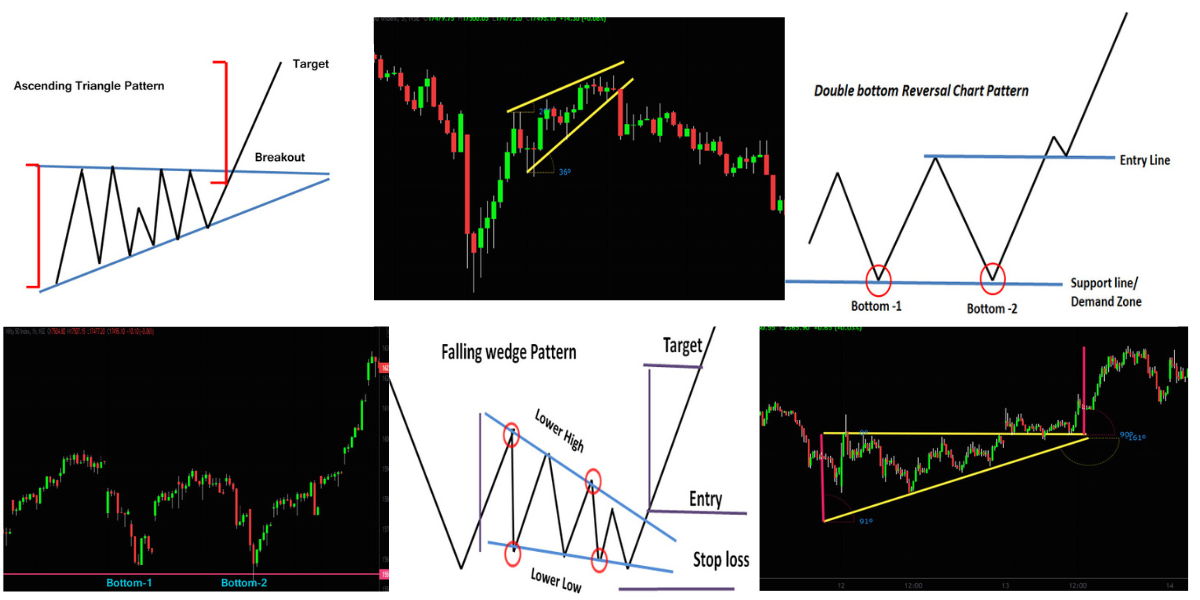
Ascending Triangle Chart Pattern


- Forms when higher lows occur and a flat resistance (top) is present.- उच्चतर लो बनते हैं और टॉप फ्लैट रहता है।
- Belongs to the continuation chart pattern type.- कंटिन्यूएशन चार्ट पैटर्न के प्रकार में आता है।
- One side of the triangle is flat, and the other slopes upwards.- एक साइड फ्लैट होती है और दूसरी ऊपर की ओर झुकी होती है।
- Wait for a breakout; the direction is confirmed if the breakout is upward.- ब्रेकआउट का इंतजार करें; दिशा कंफर्म होती है अगर ब्रेकआउट ऊपर की ओर हो।
- Target is typically the length of the triangle’s third side.- लक्ष्य आमतौर पर ट्रायंगल की तीसरी साइड की लंबाई के बराबर होता है।
Descending Triangle Chart Pattern-डिसेंडिंग ट्रायंगल चार्ट पैटर्न


- Forms when lower highs occur and a flat support (bottom) is present.- लोअर हाई बनते हैं और बॉटम फ्लैट रहता है।
- Belongs to the continuation chart pattern type.- कंटिन्यूएशन चार्ट पैटर्न के प्रकार में आता है।
- One side of the triangle is flat, and the other slopes downwards.-एक साइड फ्लैट होती है और दूसरी नीचे की ओर झुकी होती है।
- Wait for a breakout; the direction is confirmed if the breakout is downward.-ब्रेकआउट का इंतजार करें; दिशा कंफर्म होती है अगर ब्रेकआउट नीचे की ओर हो।
- Target is typically the length of the triangle’s third side.- लक्ष्य आमतौर पर ट्रायंगल की तीसरी साइड की लंबाई के बराबर होता है।
Symmetrical Triangle Chart Pattern-सिमेट्रिकल ट्रायंगल चार्ट पैटर्न


- Forms when lower lows and lower highs occur.-लोअर लो और लोअर हाई बनते हैं।
- Both sides of the triangle slope at an angle.- दोनों साइड एंगल पर झुकी होती हैं।
- Indicates no clear market trend.- बाजार में कोई स्पष्ट प्रवृत्ति नहीं दिखती।
- Wait for a breakout, which can be in either direction.- ब्रेकआउट का इंतजार करें, जो किसी भी दिशा में हो सकता है।
- Target is typically the length of the triangle’s third side.- लक्ष्य आमतौर पर ट्रायंगल की तीसरी साइड की लंबाई के बराबर होता है।
Double Bottom Reversal Candlestick Chart Pattern- डबल बॉटम रिवर्सल चार्ट पैटर्न


- Also known as W-Bottom due to its shape.- इसे डब्ल्यू-बॉटम भी कहा जाता है।
- Forms during a downtrend and signals a possible reversal.- डाउनट्रेंड के दौरान बनता है और रिवर्सल का संकेत देता है।
- Wait for a breakout above the breakout candle’s high.- ब्रेकआउट कैंडल की ऊंचाई से ऊपर ब्रेकआउट का इंतजार करें।
- Place stop-loss below the breakout candle’s low and set the target based on the risk-reward ratio.-स्टॉप-लॉस ब्रेकआउट कैंडल के नीचे रखें।
- More reliable when formed on larger timeframes .बड़े टाइमफ्रेम पर अधिक विश्वसनीय।


Double Top Reversal Chart Pattern-डबल टॉप रिवर्सल चार्ट पैटर्न

- Also known as M-Top due to its shape.-इसे एम-टॉप भी कहा जाता है।
- Forms during an uptrend and signals a possible reversal.-अपट्रेंड के दौरान बनता है और रिवर्सल का संकेत देता है।
- Wait for a breakout below the breakout candle’s low.- ब्रेकआउट कैंडल की लो से नीचे ब्रेकआउट का इंतजार करें।
- Place stop-loss above the breakout candle’s high and set the target based on the risk-reward ratio.-ब्रेकआउट कैंडल के हाई के ऊपर स्टॉप-लॉस लगाएं और लक्ष्य रिस्क-रिवॉर्ड के हिसाब से तय करें।
- More reliable when formed on larger timeframes.( Daily/weekly)- बड़े टाइमफ्रेम पर अधिक विश्वसनीय।
Head and Shoulder Reversal Chart Pattern-हेड एंड शोल्डर रिवर्सल चार्ट पैटर्न


- Forms during an uptrend and signals a reversal.-अपट्रेंड के दौरान बनता है और रिवर्सल का संकेत देता है।
- Named due to its resemblance to a person’s head and shoulders.-यह एक व्यक्ति के सिर और कंधों की तरह दिखता है।
- Wait for a breakout below the neckline.-नेकलाइन के नीचे ब्रेकआउट का इंतजार करें।
- Place stop-loss above the breakout candle’s high and set the target based on the risk-reward ratio.-ब्रेकआउट कैंडल के हाई के ऊपर स्टॉप-लॉस लगाएं और लक्ष्य रिस्क-रिवॉर्ड के हिसाब से तय करें।
- More reliable on larger timeframes. -बड़े टाइमफ्रेम पर अधिक विश्वसनीय।
Inverted Head and Shoulder Reversal Chart Pattern
इनवर्टेड हेड एंड शोल्डर रिवर्सल चार्ट पैटर्न

- Forms during a downtrend and signals a reversal. -डाउनट्रेंड के दौरान बनता है और रिवर्सल का संकेत देता है।
- The opposite of the head and shoulders pattern.- हेड एंड शोल्डर पैटर्न का उल्टा।
- Wait for a breakout above the neckline.- नेकलाइन के ऊपर ब्रेकआउट का इंतजार करें।
- Place stop-loss below the breakout candle’s low and set the target based on the risk-reward ratio.- ब्रेकआउट कैंडल के हाई के ऊपर स्टॉप-लॉस लगाएं और लक्ष्य रिस्क-रिवॉर्ड के हिसाब से तय करें।
- More reliable on larger timeframes.- बड़े टाइमफ्रेम पर अधिक विश्वसनीय।
Bullish Flag Continuation Candlestick Chart Pattern -बुलिश फ्लैग कंटिन्यूएशन पैटर्न

- Forms during an uptrend and signals trend continuation.- अपट्रेंड के दौरान बनता है और ट्रेंड जारी रहने का संकेत देता है।
- Wait for a breakout above the breakout candle’s high.- ब्रेकआउट कैंडल की ऊंचाई से ऊपर ब्रेकआउट का इंतजार करें।
- Place stop-loss below the breakout candle’s low.-ब्रेकआउट कैंडल के हाई के ऊपर स्टॉप-लॉस लगाएं
- Target can be set based on the height of the flagpole.- लक्ष्य को फ्लैगपोल की ऊंचाई के आधार पर तय किया जा सकता है।
Bearish Inverted Flag Continuation Candlestick Chart Pattern -बेयरिश इनवर्टेड फ्लैग कंटिन्यूएशन पैटर्न

- Forms during a downtrend and signals trend continuation.डाउनट्रेंड के दौरान बनता है और ट्रेंड जारी रहने का संकेत देता है।
- Wait for a breakout below the breakout candle’s low.-ब्रेकआउट कैंडल की लो से नीचे ब्रेकआउट का इंतजार करें।
- Place stop-loss above the breakout candle’s high. ब्रेकआउट कैंडल के हाई के ऊपर स्टॉप-लॉस लगाएं
- Target can be set based on the height of the flagpole.-लक्ष्य को फ्लैगपोल की ऊंचाई के आधार पर तय किया जा सकता है।
Rising Wedge Candlestick Chart Pattern (Bullish Reversal)-राइजिंग वेज चार्ट पैटर्न (बुलिश रिवर्सल)


- A reversal pattern that starts with an uptrend but transitions to a downtrend.- अपट्रेंड से शुरू होता है लेकिन डाउनट्रेंड में बदल जाता है।
- Forms higher highs and lower highs, with a narrowing price range. – हायर हाई और लोअर हाई बनते हैं।
- Wait for a breakout below the breakout candle’s low.- ब्रेकआउट कैंडल की लो (निचले स्तर) से नीचे ब्रेकआउट का इंतजार करें।
- Place stop-loss above the breakout candle’s high. ब्रेकआउट कैंडल के हाई के ऊपर स्टॉप-लॉस लगाएं
Falling Wedge Candlestick Chart Pattern (Bearish Reversal)-. फॉलिंग वेज पैटर्न (बेयरिश रिवर्सल)


- A reversal pattern that starts with a downtrend. -डाउनट्रेंड से शुरू होता है।
- Forms lower highs and lower lows, with a narrowing price range.- लोअर हाई और लोअर लो बनते हैं।
- Wait for a breakout above the breakout candle’s high.
- Place stop-loss below the breakout candle’s low.
Key Notes:
- Always wait for a confirmed breakout before taking trades.हमेशा कंफर्म ब्रेकआउट का इंतजार करें।
- Place stop-loss and targets based on the risk-reward ratio.स्टॉप-लॉस और लक्ष्य रिस्क-रिवॉर्ड अनुपात पर आधारित रखें।
- Larger timeframes make these patterns more reliable. बड़े टाइमफ्रेम पर ये पैटर्न अधिक विश्वसनीय होते हैं।
डॉलर की कमजोरी और बढ़ती महंगाई IT सेक्टर में गिरावट ला सकती है?